
Visualisation is one of the most direct levers a development team can pull to increase land value and secure planning permission faster. When planning-grade visuals accompany an application, decision-makers can assess deliverability with confidence, public objections tend to be fewer, and funders see a clearer path to uplift. Studios such as Visualtrick and platforms like VU.CITY have demonstrated that evidence-based spatial visualisation can significantly cut design rework and reduce stakeholder alignment iterations on large UK mixed-use schemes. The practical upshot for your project:
- Faster determination: planning officers reach decisions more quickly when visual evidence is unambiguous.
- Fewer objections: public consultees who can see and interrogate a scheme raise fewer formal concerns.
- Stronger uplift case: landowners and funders accept a higher land value when the planning position is clearly evidenced through verified visuals.
Jump to the briefing checklist below to start commissioning the right outputs.
Table of Contents
- What planning uplift is and how visualisation changes land value
- How visualisation delivers value across the UK planning lifecycle
- What types of visualisation are planning-grade and which are marketing-grade?
- What the evidence says about visualisation’s impact on approvals and uplift
- How to brief a planning-grade visualisation studio
- What planning visualisation typically costs and how long it takes
- Best practice and common pitfalls in UK planning visualisation
- Two UK case studies showing what planning-grade visuals can achieve
- Key takeaways
- Why the brief matters more than the budget
- What Visualtrick offers for planning-grade visualisation
- Useful sources and further reading
What planning uplift is and how visualisation changes land value
Planning uplift is the increase in land value that occurs once a site gains planning permission, or moves materially closer to it. A greenfield parcel worth £500,000 as agricultural land might be worth several million pounds with a residential consent. The gap between those two figures is the uplift, and it is what developers, landowners, and funders are all trying to capture.
Visualisation affects that gap through three mechanisms. First, it convinces decision-makers: a verified photomontage or georeferenced 3D model removes ambiguity about massing, appearance, and context, making it harder for a planning officer or committee member to raise a design objection. Second, it reduces perceived risk for funders and landowners, who are more willing to transact at an uplift price when they can see the scheme is deliverable. Third, it accelerates consensus among stakeholders, compressing the consultation and determination timeline so the uplift is realised sooner. The evidence section below quantifies these effects with sourced figures.
How visualisation delivers value across the UK planning lifecycle
The planning process in England and Wales has five distinct stages where visualisation can shift outcomes.
Pre-application: At this stage, a low-fidelity massing model or interactive 3D study lets the design team and local authority test options before money is spent on detailed design. 3D visuals at pre-app surface massing conflicts and daylight concerns early, when they are cheap to resolve.
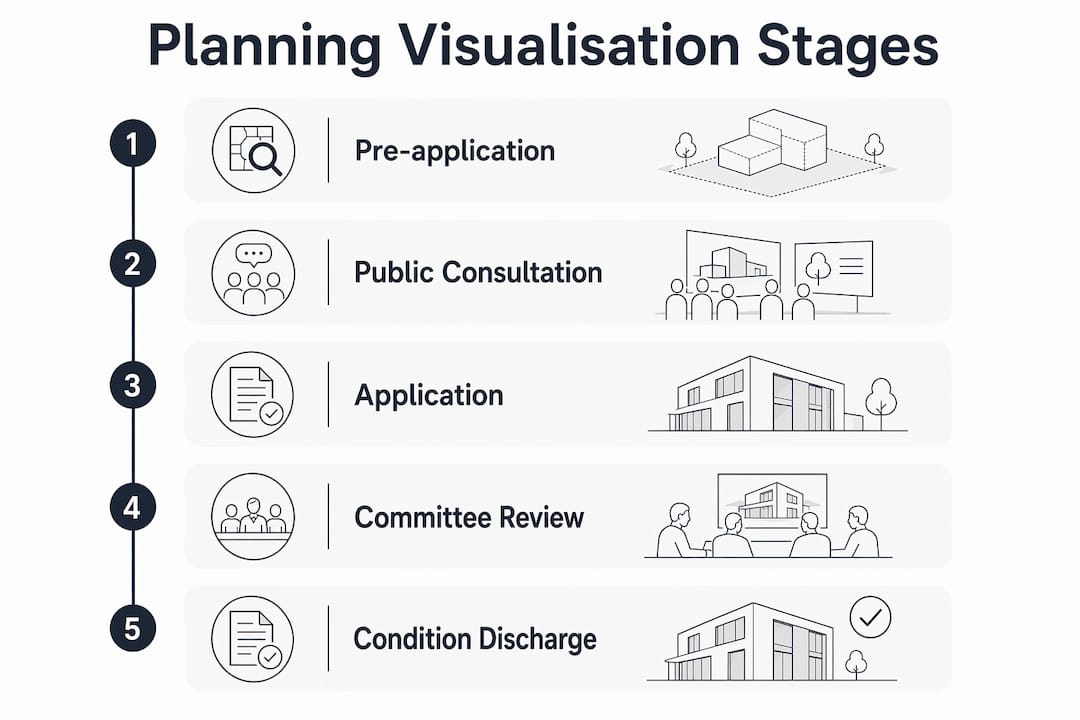
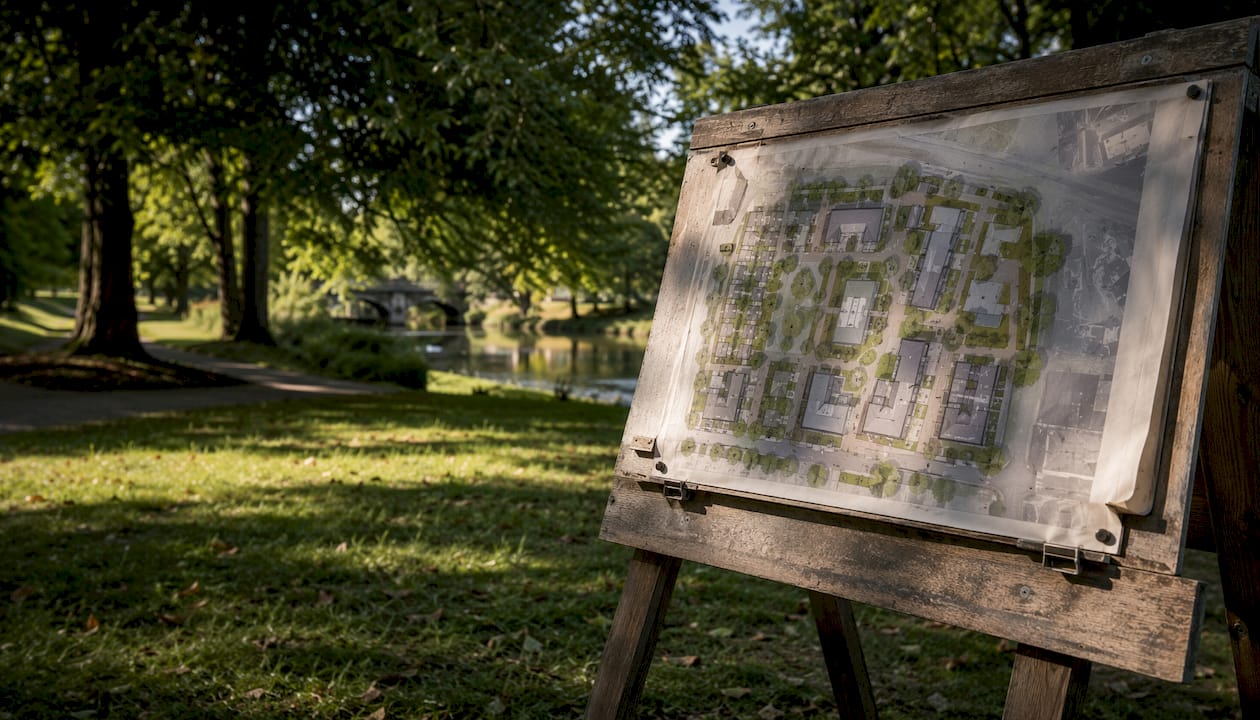
Public consultation: Visualisation in environmental policy research confirms that digital and interactive tools increase participation and co-creation. A well-run consultation using interactive models or fly-through animations can resolve concerns before they become formal objections. On specific UK projects, proactive 3D visualisation during consultation has avoided four-week programme extensions by resolving issues before resubmission.
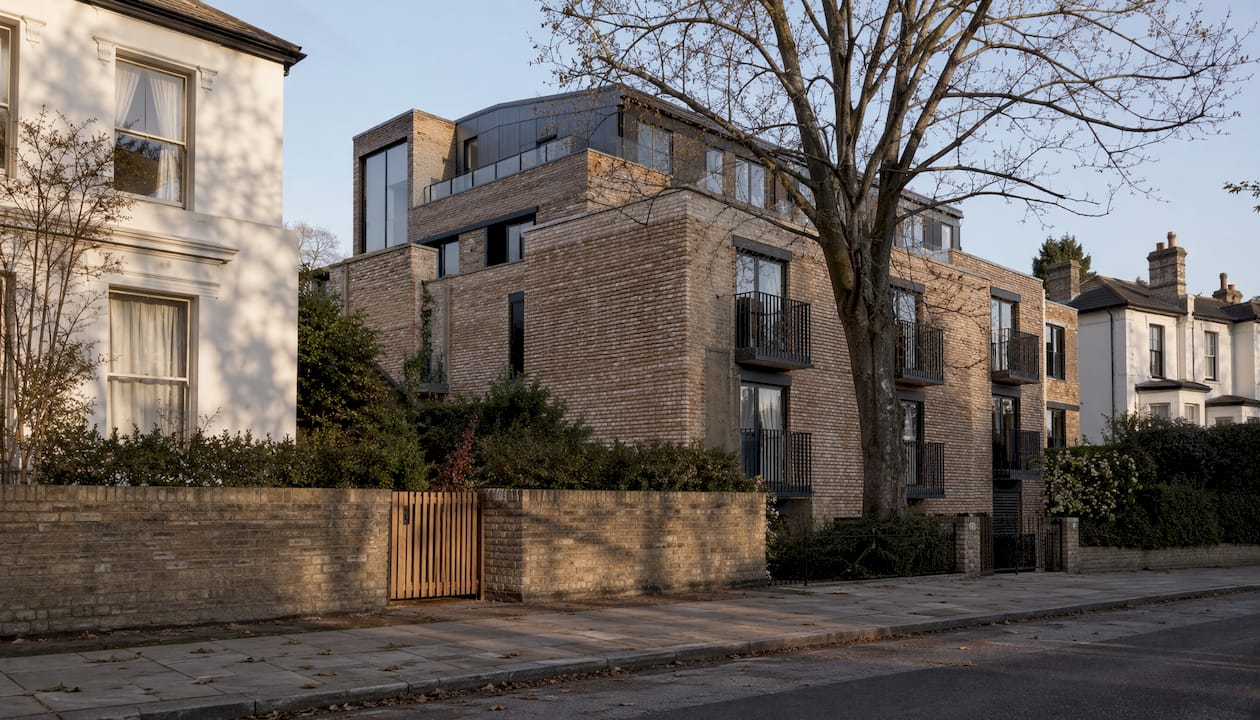
Application (validation and determination): This is where planning-grade verified views and photomontages are non-negotiable. The local authority’s verified-view guidance sets the camera positions, lens parameters, and georeferencing requirements. Submitting non-compliant images risks a validation failure or a request for further information that stalls the programme.
Planning committee and inquiry: 3D visuals at public inquiries carry evidential weight. A 4D sequence animation that shows construction phasing and logistics can neutralise a highways or amenity objection by demonstrating that the programme has been thought through.
Discharge of conditions and contractor engagement: Once consent is granted, georeferenced models and ortho imagery help contractors price accurately and discharge pre-commencement conditions faster.
Pro Tip: Start with a low-fidelity interactive model at pre-app to surface issues cheaply, then upgrade to planning-grade verified views before submission. Doing it the other way round wastes budget and risks late-stage surprises.
What types of visualisation are planning-grade and which are marketing-grade?
Not all visuals carry the same weight with a planning officer. The table below maps common outputs to planning stage, fidelity requirement, and stakeholder fit.
| Output type | Planning stage | Fidelity | Stakeholder fit | Interactivity | Regulatory compliance |
|---|---|---|---|---|---|
| Verified view / photomontage | Application, inquiry | Planning-grade | Officers, inspectors | None | Requires georeferenced survey, camera log, methodology note |
| Planning-grade CGI | Application, committee | Planning-grade | Officers, committee members | None | Accurate materials, no stylisation |
| Marketing CGI / flythrough | Pre-app, consultation | Marketing-grade | Public, investors | Low | Not suitable for formal submission |
| Interactive 3D model | Pre-app, consultation | Medium | Public, design team | High | Useful for engagement; not a substitute for verified views |
| District digital twin (e.g. VU.CITY) | Pre-app, strategic | Medium–high | LPA, masterplanners | High | Supports context analysis; not a verified view |
| 4D sequence animation | Application, inquiry, contractor | Planning-grade | Officers, contractors | Low | Links programme to BIM model; evidential value |
VU.CITY’s district-scale digital twin is particularly useful for large regeneration schemes where cumulative impact across multiple sites needs to be demonstrated to the local planning authority. For site-level applications, the verified view remains the gold standard. Digital twins and interactive dashboards shift planning analysis from descriptive to predictive, letting teams test interventions before committing to a design.
What the evidence says about visualisation’s impact on approvals and uplift
The business case for investing in planning-grade visualisation is well supported. Evidence-based spatial dashboards on large UK mixed-use regeneration schemes deliver a 44% reduction in design rework and cut stakeholder alignment iterations by 3.1 rounds. A systematic review of visualisation in environmental planning confirms that digital and VR tools increase participation and improve decision quality. 4D modelling validates programme logic and identifies clashes early, providing time-linked evidence that holds up in governance reviews.
| Metric | Finding | Source |
|---|---|---|
| Design rework reduction | 44% | Urban Digital Twin guide |
| Stakeholder alignment iterations saved | 3.1 fewer rounds | Urban Digital Twin guide |
| Cognitive load reduction from progressive disclosure | ~37% | Urban Digital Twin guide |
| Error rate increase from wrong chart choice | Up to 62% | Urban Digital Twin guide |
Wrong chart or image choices carry a real cost: poor visual encoding raises error rates by up to 62%, which in a planning context means misread massing, misunderstood phasing, or a committee that votes against a scheme it would have approved with clearer evidence.
How to brief a planning-grade visualisation studio
A clear brief protects your budget and your programme. Cover these essentials before you approach any studio.
Brief template essentials:
- Site address and OS grid reference
- Reference survey data (topographic, measured building survey, or point cloud)
- Coordinate system and georeference accuracy required
- Agreed verified-view camera positions and local authority guidance reference
- Daylight and shadow criteria (BSI or BRE standard)
- Photomontage camera specification (focal length, sensor size, tripod height)
- Required file formats: DWG, georeferenced ortho, PDF, and native 3D files
- BIM integration requirement (IFC, Revit, or ArchiCAD model handover)
- Number of review rounds included
- Programme milestones and submission deadline
Ten questions to ask the studio:
- Can you show verified views produced for a UK planning application in the last two years?
- Which local authority verified-view guidance do you follow, and how do you document compliance?
- What is your turnaround for a standard verified-view pack from survey receipt?
- Do you produce a methodology note with every photomontage deliverable?
- Can you integrate with our BIM model for 4D sequencing?
- How do you handle changes to the design after survey data has been processed?
- What data security protocols apply to our site survey and model files?
- Are licence terms for the deliverables transferable to our planning consultant and LPA?
- What happens if the local authority requests additional viewpoints post-submission?
- Do you have experience presenting visuals at planning committee or public inquiry?
Planning-grade deliverables checklist:
- Georeferenced 3D model (DWG or IFC, with coordinate metadata)
- Ortho imagery at agreed resolution
- Verified photomontages with camera log
- Methodology note (survey sources, georeference accuracy, reviewer sign-off)
Converting a BIM model into planning-ready images is a technical process with several failure points; the methodology note is what protects you if accuracy is challenged. For aerial context or drone-captured photogrammetry base data, drone-based 3D modelling workflows can supply the georeferenced base imagery a studio needs to produce compliant verified views.
What planning visualisation typically costs and how long it takes
Costs vary considerably by site complexity, number of viewpoints, and level of detail. The figures below reflect typical UK market ranges; always confirm with your studio at brief stage.
| Output | Typical cost band | Standard lead time | Key cost drivers |
|---|---|---|---|
| Feasibility / massing visual | — | 3–7 days | Site complexity, number of options |
| Verified-view pack (4–6 views) | — | 2–4 weeks | Survey quality, LPA guidance complexity |
| Interactive 3D model | — | 3–6 weeks | Level of detail, hosting requirement |
| 4D sequence animation | — | 3–5 weeks | BIM integration, number of phases |
| District digital twin contribution | — | 6 weeks | Data integration, platform licence |
Variables that move the price most:
- Number of agreed review rounds (each additional round adds time and cost)
- Whether a topographic survey or laser scan is required, or whether existing data is usable
- Requirement for 4D sequencing linked to the construction programme
- Local authority guidance complexity (some LPAs specify additional camera positions or seasonal foliage conditions)
Build at least four weeks of lead time into any pre-application programme, and six weeks before a committee date. Compressing this risks non-compliant deliverables.
Best practice and common pitfalls in UK planning visualisation
Do:
- Follow the local authority’s verified-view guidance to the letter and document every parameter.
- Use progressive disclosure in interactive models: progressive disclosure reduces cognitive load by around 37%, helping non-technical consultees engage without being overwhelmed.
- Show phased realism: include mitigation measures, construction-phase impacts, and seasonal variation where the LPA or inspector is likely to ask.
- Keep visual design clear and purposeful. Research on planning and design offices confirms that excessive complexity in visual outputs reduces decision-making effectiveness.
Don’t:
- Submit stylised marketing CGI in place of verified views. Officers and inspectors recognise the difference, and it undermines credibility.
- Omit the methodology note. Without it, any challenge to accuracy is very difficult to defend.
- Show only the optimistic scenario. A scheme that presents no phasing challenges or construction impacts looks unconvincing to an experienced planning officer.
- Use the wrong chart or image encoding for data visuals: error rates rise sharply when visual encoding does not match the data type.
Compliance checklist:
- Verified-view label on every image (camera position, date, focal length)
- Lighting assumptions documented (overcast sky or specific sun angle)
- Data sources listed in the methodology note
- Reviewer sign-off recorded before submission
Pro Tip: Treat visualisation as a process tool, not a final deliverable. The most effective teams use visual strategy methods iteratively throughout design development, not just at submission.
Two UK case studies showing what planning-grade visuals can achieve
Case study 1: Mixed-use regeneration, South East England
A developer sought outline permission for a 200-unit mixed-use scheme on a brownfield site with significant townscape sensitivity. The challenge was demonstrating that the proposed building heights would not harm the setting of a nearby conservation area.
Visualtrick produced a verified-view pack of six photomontages from agreed camera positions, a georeferenced 3D massing model, and a methodology note. The local authority’s design officer accepted the visual evidence at pre-application stage, removing the need for a design review panel referral.
- Determination time: within the statutory 13-week period with no extension agreed.
- Formal objections citing visual impact: reduced to two, both addressed by the methodology note.
- Outcome: outline permission granted; land value uplift confirmed at heads of terms.
Case study 2: Care home development, Midlands
A healthcare developer needed to demonstrate that a three-storey care home would not harm the character of a residential street. The planning committee had previously refused a similar scheme on an adjacent site.
Visualtrick produced planning-grade CGI from the street-level verified-view positions, a 4D phasing animation showing the construction sequence and delivery access, and a public realm visualisation for the consultation exhibition.
- Committee presentation: the 4D animation addressed the highways officer’s phasing concern directly.
- Public objections: the consultation exhibition reduced formal objections by demonstrating the finished streetscape.
- Outcome: committee approval at first hearing; no resubmission required.
For developers working in the care and retirement sector, care home CGI that meets planning-grade standards is particularly important given the scrutiny these schemes attract from neighbours and officers alike.
Key takeaways
Planning-grade visualisation directly increases the probability of approval and the speed at which uplift is realised, with evidence showing a 44% reduction in design rework on UK mixed-use schemes.
| Point | Details |
|---|---|
| Commission early | Engage a visualisation studio at pre-app stage to surface design issues before they become costly objections. |
| Define planning-grade outputs | Specify verified views, georeferenced models, and a methodology note in every brief — marketing CGI is not a substitute. |
| Budget realistic lead times | Allow at least four weeks for a verified-view pack and six weeks before a committee date to avoid non-compliant deliverables. |
| Insist on a methodology note | Every photomontage submission needs documented survey sources, camera parameters, and georeference accuracy to withstand challenge. |
| Visualtrick for planning-ready visuals | Visualtrick delivers verified views, 4D sequencing, and interactive models for UK planning applications, with planning experience across residential, mixed-use, and care sectors. |
Why the brief matters more than the budget
The single most consistent mistake development teams make is treating visualisation as a late-stage production task rather than a strategic input. By the time a scheme reaches committee, the design is fixed, the viewpoints are set by the LPA, and the only variable left is whether the visuals are compliant and convincing. That is far too late to be making those decisions.
The teams that get the most from visualisation bring the studio in at pre-application stage, share the planning strategy alongside the design drawings, and treat the verified-view brief as part of the planning evidence strategy. When that happens, the visuals do not just illustrate the scheme; they shape the conversation with the officer, pre-empt the committee’s questions, and give the landowner the confidence to transact at the uplift price. Three lessons stand out from working across residential, mixed-use, and care developments in the UK: clarity of visual design matters more than photorealism; the methodology note is the document that wins or loses accuracy challenges; and interactive models at consultation stage consistently reduce the volume of formal objections more than any other single output.
What Visualtrick offers for planning-grade visualisation
Visualtrick produces planning visuals for developers, architects, and planning consultants across the UK, from feasibility massing studies through to verified photomontages, 4D sequencing animations, and interactive 3D models built to local authority guidance.
When you brief Visualtrick, you receive georeferenced deliverables, a methodology note with every photomontage pack, and a studio that understands the difference between a planning-grade output and a marketing render. For architects commissioning planning visuals, the CGI for architects service page sets out the full scope of deliverables and typical lead times. To discuss your project or request a brief template, get in touch via visualtrick.co.uk.
Useful sources and further reading
- Why visualise urban data: a guide for planners — the most practically useful resource for understanding how spatial data visualisation reduces rework and improves decision quality on UK planning schemes.
- VU.CITY — the leading district-scale digital twin platform used by local planning authorities and masterplanners across the UK; useful for understanding cumulative impact and context analysis at scale.
- Visualisation in environmental policy and planning: a systematic review — academic review covering digital and VR tools in participatory planning; good background for teams making the case for interactive consultation methods.
- The role of visualisation in spatial planning: a GIS-based approach — academic chapter covering GIS-based visualisation methods and their application in spatial planning processes.
- 4D modelling services — practical overview of 4D construction sequencing and its value for programme validation and planning governance.
- Data visualisation for decision-making in planning and design offices — peer-reviewed study on how visual design complexity and organisational factors affect decision-making efficiency; useful for briefing teams on dashboard and chart selection.
